Analytics that’s Metrics Centred, with Allan Wille

Allan Wille

Episode 219

Up to the 18th century, making and trading things was harder than it needed to be. You had to deal with a bewildering patchwork of local constants and norms. It was actually the French Revolution & administrators who came out of it that started to codify how we measure things. The standards they adopted were ultimately formalized in 1875 at a Convention  whose name you may recognize, the Metre – or should I say Meter –  Convention. 

The Standard set at the convention spread beyond France to most of Europe, removing friction in commerce and everyday life. Engineers could spec parts to the same tolerances; pharmacists could dose reliably across borders; food producers could print consistent nutritional labels; shipbuilders and container makers could agree on common dimensions; and architects and builders could order materials that matched on site. Over decades that shared language of measurement turned local guesswork into dependable infrastructure for industry, science and trade. Today, About 95% of the world’s population lives in countries that have officially adopted the metric system.

“Metric” in that sense solved disagreement about how much — it replaced local guesswork with a shared language of measurement so engineers, traders and regulators could trust one another.

Businesses face the same problem today — only the units have changed. Instead of metres and kilograms, modern organizations trade in clicks, sessions, impressions, cost, conversions and revenue. These are the metrics that power decisions, budgets and boardroom arguments. If one team’s “conversion” counts form submissions, another’s counts purchase intents, and a third’s counts paid signups, you get the same mess Europe lived with before standardization: wasted effort, mistrust, and bad decisions.

That’s why the digital-era equivalent of adopting the metric system matters: a single, governed vocabulary of business metrics (clear definitions, lineage, owners and calculational rules). Give everyone the same definition of “revenue,” “LTV,” or “ROAS” — and the same ability to trace where those numbers came from — and you turn noisy arguments into aligned action. In short: standardize the units, restore trust in the numbers, and your dashboards start to behave like the modern factories that metrication once enabled for Europe.

Turn to how many marketing teams are now constrained by the disparate marketing measures we have – it’s the choke-point preventing us from sharing dashboards between groups, asking bigger questions, and getting full bang for money spent on our analytics infrastructures. If we’re going to keep our sanity, we must get on with Metricizing our metrics. Going down a path where business metrics are treated as standardized units opens up possibilities as big as the Metric System opened up for our global economy. 

Our guest is a Proud Swiss-Canadian, technologist and entrepreneur. In 2001 he co-founded analytics software company Klipfolio, one of whose products aims to address metric management. Note that I’m having him on today to give his personal perspective – there’s no sponsor or affiliate relationship here. When he’s not working in or talking about analytics, you’ll find him cycling in the city we both call home. Let’s go talk to Allan Wille. 

 Timestamp Chapters

0:00:00 Standardizing Digital Metrics: A Modern Metric System
0:03:44 The Spreadsheet Era: Data Insights and Hidden Dangers
0:07:43 Leveraging APIs for Consistent and Mature Data Pipelines
0:11:39 Why Data Governance is Crucial for Trust in Metrics
0:19:29 Elevating Metrics: From Raw Data to Business Contracts
0:25:14 Bridging the Gap: Metric Catalogs for Data Teams
0:29:49 How AI is Standardizing Metric Definitions and Trust
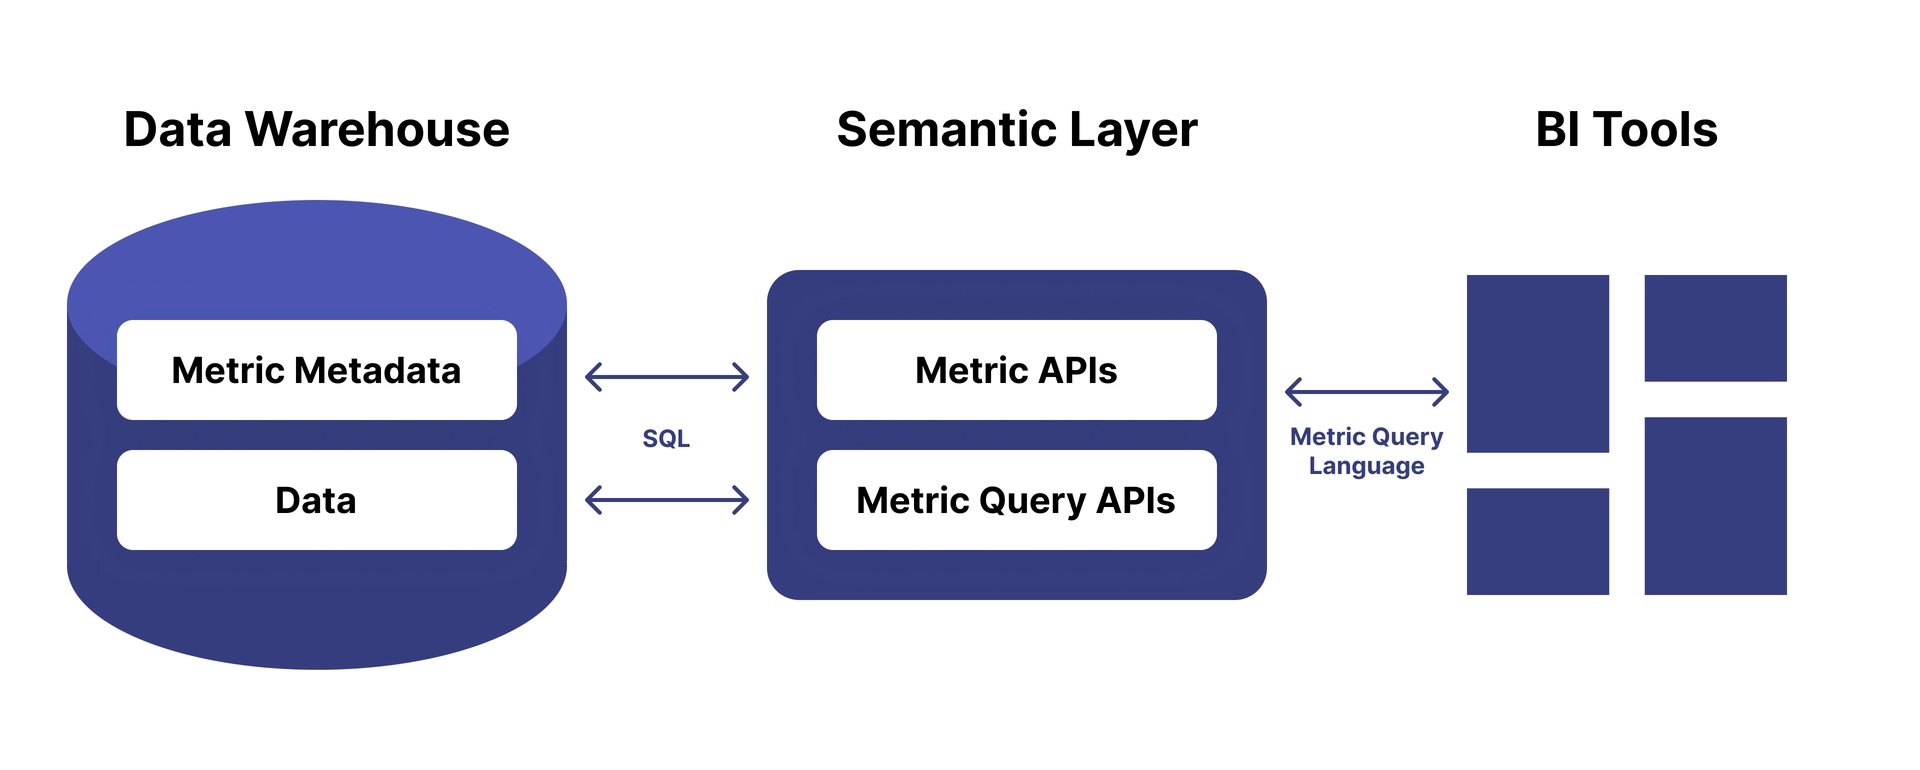
0:37:44 Navigating Data Architecture: Semantic Layers and Power Metrics
0:44:26 Finding Your North Star: Metrics for Business Success


Listen to episode

People, products or concepts mentioned on the show:

Allan Wille on LinkedIn

Allan’s Metrics Stack Podcast

Powermetrics.app

MetricHQ.org

The meaning of Ontology is found in the Definition section of this blog.

Wayne Eckerson

Glenn and Allan recording

Website Wealth, with Philippa Gamse

Website Wealth with Philippa Gamse

Episode 216

One of the best known events in the modern Olympics is the High jump. Since its dawn in 1896 all jumpers used the same technique. They would run towards the bar, then begin their vault by putting one leg over, or trying to go head-first over the bar. But someone came to the 1968 Mexico City games, who couldn’t win on physicality, but who did have a hack no one had thought of. 


That person was 21 year old American Dick Fosbury, who you wouldn’t find anything notable looking back at his track career.  Back in high school he’d struggled to master  all the motions used in the high jump; and coaches noted how little he practiced; when time came for track meet qualifiers, his jumps came up short. 

But when he got to University for civil engineering, he began to experiment with other ways of jumping. In his studies he learned that our ability to jump is limited by our centre of gravity. Lifting our whole body over a bar at the same time demands that we raise our centre of gravity to that same height. So Fosbury analyzed to see if there was a way to get a human over the bar one part at a time, which temporarily moves our whole centre of gravity to somewhere below us, even below the bar. That means that without jumping any higher, we can clear a higher bar – it’s playing a trick on physics. 


Fosbury used the technique selectively for 2 seasons because his coach still went by the tried-and-true technique, and the heights he cleared got higher & higher. It wasn’t until a month before Mexico City that he secured him a spot on Team USA. 

The Olympics was the first moment where everyone saw Fosbury’s new  backflip maneuver – the press coined it the Fosbury Flop. Everyone also noticed his performance – he didn’t miss a jump right up to the metal round.  I bet as international competitors watched him advance while they hit the bar must have felt pretty disarmed by that flop. The bar was raised in the finals to  2.24M or 7 ft 4¼ in, higher than at any games before. Fosbury missed on his first two attempts, but cleared on his third, winning the Olympic gold medal and broke the Olympic record 


Ever since, this back-first technique has been the obvious way every jumper has used. Fosbury’s style so clearly solved the high jump problem, we don’t even question it.   


Lots of problems seem unsolvable until an obvious solution is posed. It’s a phenomena today’s guest commonly sees on websites. Her recently-launched book puts it this way: “The solutions we implemented may seem obvious in hindsight, but the problems and opportunities remained hidden until we analyzed their data in depth-and that’s the point!”


Our guest has spent 25 years teaching  digital marketing strategy and analytics at business schools and consulting to companies whose websites generate hundreds of millions of dollars. She is the author of “42 Rules for a Website That Wins” and came out in 2025 with “Website Wealth: A Business Leader’s Guide to Driving Real Value from your Analytics”. Let’s go to Northern California to speak with Philippa Gamse. 


Listen to episode

People/Products/Concepts Mentioned in Show

https://en.wikipedia.org/wiki/Dick_Fosbury

Philippa Gamse on LinkedIn

Website Wealth book

Optimizing Marketing with Statistics, with Ateeq Ahmad

Optimizing Marketing with Statistics, with Ateeq Ahmad

Episode 213

Sometimes, to reach a solution, we must take unfamiliar paths. 

In the early 1940s, a brilliant mathematician named Abraham Wald left his homeland in Hungary fleeing the spectre of war. He moved to the United States, and became part of a team at Columbia University tasked in 1942 with an aspect of the war where the Allies were losing badly to the Nazis. It involved the many Allied planes that would leave from England but never return to their bases, having been shot down somewhere over Europe. These B‑17 and B‑24 bombers had 10-man crews, weighed up to 30-32 tonnes, had wingspans of 100-110 feet, and were defended by machine guns planted along the plane’s entire length. Despite all this, they would lose planes every day, presumably because they’d taken enemy fire and  either crashed during their campaign or as they headed back over the English Channel. 

Wald’s team had to determine how to minimize bomber losses. They had been poring over aircraft returning from missions, mapping out the distribution of bullet holes across their fuselages. Their plan seemed logical — reinforce the areas with the most damage. But Wald saw what others missed.

Wald realized their sample set of data represented the survivors — the aircraft that had taken hits and still managed to return safely. There were other planes they weren’t examining, ones at the bottom of the channel or in occupied territory, that didn’t  make it back. This lack of data could be biasing them to look at the problem backward. The planes they couldn’t sample could have  been struck in areas that were more critical. Maybe the fact they were hit in those vulnerable spots was the reason behind them crashing and that the lack of damage in those spots on the surviving bombers simply meant they’d been lucky! the returning planes weren’t the rule, they were the exception. 

Having flipped the problem around, the planes received reinforcements where the damage must be catastrophic, and from them on many more B17s and B24s completed their missions, helping the allies to victory in Europe. Some people call what Wald showed intuition, but that’s not what saved the allied bombers. Even though his approach seemed counterintuitive, data guided Wald to the solution. 

This is Funnel Reboot, the podcast for analytically-minded marketers. Today’s episode goes outside our comfort zone, showing statistical tools in the hopes we’ll get a bit more comfortable using them.

Our guest today is someone who uses the same kind of critical reasoning – and statistics – to make sense of their product marketing problems. He is both someone who implements analytics tools, having configured over 500 sites, and one who posts prolifically about what he’s learned. He has also taught analytics at several New York colleges, and speaks at regional MeasureCamp events. After earning his MBA from Pennsylvania Western University, he spent about 20 years in corporate analytics. Then in 2017 with the support of his wife and three daughters, he set up his own firm, Albany Analytics. Listen now as he teaches you some tools that might help in your own marketing programs.

Let’s now go hear from Ateeq Ahmad.


Listen to episode

People, products and concepts mentioned in the show

Contact Ateeq via AlbanyAnalytics.com  

Ateeq on LinkedIn

Albany Analytics on X

Ateeq on Instagram

Reactions to an Ad at each successive impression:

The 1st time people look at an ad, they don’t see it.

The 2nd time, they don’t notice it.

The 3rd time, they are aware that it is there.

The 4th time, they have a fleeting sense that they’ve seen it before.

The 5th time, they actually read the ad.

The 6th time, they thumb their nose at it.

The 7th time, they get a little irritated with it.

The 8th time, they think, “Here’s that confounded ad again.”

The 9th time, they wonder if they’re missing out on something.

The 10th time, they ask their friends or neighbors if they’ve tried it.

The 11th time, they wonder how the company is paying for all these ads.

The 12th time, they start to think that it must be a good product.

The 13th time, they start to feel the product has value.

The 14th time, they start to feel like they’ve wanted a product like this for a long time.

The 15th time, they start to yearn for it because they can’t afford to buy it.

The 16th time, they accept the fact that they will buy it sometime in the future.

The 17th time, they make a commitment to buy the product.

The 18th time, they curse their poverty because they can’t buy this terrific product.

The 19th time, they count their money very carefully.

The 20th time prospects see the ad, they buy what it is offering.

Related Funnel Reboot Episode with Tim Wilson

Statistical tests:

Correlation – are two metrics related

T-tests – when and how to use them

Chi-Square Tests and their uses

RFM Modeling – best for email marketers

Market Basket Analysis – Products bought together

Yours truly with Ateeq, co-leading a MeasureCamp session

From Armageddon to GA4 Alignment, with Neil Shapiro

Neil Shapiro

Episode 210

Since July 1st, 2023, the world of web analytics has undergone a seismic shift—and if you’re still reeling from the transition to Google Analytics 4, you’re not alone. In this episode, we unpack what many are calling the ‘Armageddon’ of digital measurement. You’ll hear why GA4 isn’t just a new version of an old tool, but a completely different ecosystem

In human years, GA4 is still a toddler. But it is growing  rapidly and some are giving it a chance to mature. 

Many marketers took their licks in the forced transitioning to GA4 and there are still some raw emotions about how this tool was rolled out. But our guest says that even though change is hard, he guest believes GA4 is the change we didn’t know we needed. 

Our guest grew up in the New York tri-state area, which gave him two passions. The first one is hockey and watching people grow up playing the game they love – he’s a lifelong Islanders fan. Working in Manhattan, he also worked a lot with numbers. Over time, he morphed from analyzing financial data to analyzing digital marketing, in tools like Google Analytics And  Adobe Analytics. He built this expertise at industries giants like American Express travel and entertainment’s NBC Universal. Wanting to use these skills without the constraints of being in a big corporation, he went independent and relocated to Las Vegas, where he now gives all kinds of companies insights into their analytics data. 

Let’s go talk to Neil Shapiro.

Shownotes:

CDP – Customer Data Platform

Neil on LinkedIn

Neil’s consultancy: Zen Digital Analytics


Listen to episode

Neil & Glenn at an analytics conference

The Data Storyteller’s Handbook, with Kat Greenbrook

Kat Greenbrook

Episode 208

  • People resist change.
  • They only stop resisting when they’re convinced the change is needed.
  • They’re only convinced change is needed when they grasp the truth.
  • The best way to present them the truth is with data. 

You might think that what works on people is a dry statistical presentation of the data in all its Indisputable, inscrutable glory. 

Nope.

Those avoiding change give themselves offramps by arguing about your data. History shows that to persuade people to take an action, it takes taking them through data in a way that grabs them emotionally. Some examples include:

Florence Nightingale
Florence Nightingale, 1854

Al Gore, 2006


princess diana minefield
Princess Diana, 1997

Numbers prove, but a story compels.

This has so much to do with marketing. Here’s why. To do what we do, our bosses / clients must be convinced in how our work is yielding results. That is the core of every story that a marketing presentation tells.  Our guest is a Data Storyteller. After graduating from Massey University in 2002, she moved into data analytics. She earned a digital design degree in 2015, combining her design and analytics skills, which led her to specialize in data storytelling. In 2016, she founded Rogue Penguin, a company focused on bridging analytics and business operations. 

She now leads workshops for professionals in data science, marketing, and design. And she’s the author of “the data storytelling handbook”

Let’s go to New Zealand to speak with Kat Greenbrook


Chapter Timestamps

0:00:00      Intro
00:05:48    Welcome Kat
00:07:45    when data storytelling is needed
00:09:00    two ways of communicating data
00:13:55    Data stories improve communication between groups
00:26:38    PSA
00:27:18    Canvas for making time stories
00:30:05    making visuals relevant to the business
00:33:19    How to present when you only have part of story
00:39:06    Conserving data-ink
00:43:00    More you show – the less you contrast
00:48:20    Getting the book or contacting Kat

People/Products/Concepts Mentioned in Show

The Data Storyteller’s Handbook

Kat on LinkedIn

Rogue Penguin


Making Numbers Count, Chip Heath, Karla Starr


Listen to episode