There’s more than one way to skin a cat. Being honest, doing something differently is often neither better or worse, it’s just different.
– Playing Music with an acoustic vs electric guitar
– Writing with a pen on paper vs a computer. And continuing on that theme, it could be a Mac or a PC
– Programming can be done in various languages
– Films can be made with a variety of filming equipment, anything from an iPhone up to an IMAX ALEXA 65mm
This also applies to what we use as our analytics tool. And though Google Analytics gets a lot of attention, including in this podcast, to be fair, it is not the only game in town. The industry has a second tool, Adobe Analytics and I wanted to talk with an expert, and to my mind, today’s guest is the person to talk to about it.
She has 15+ years of experience helping enterprise organizations solve their analytics problems holistically, no matter where they are in their digital measurement evolution or what tool set they use.
Few can go as deep on pixel implementation, tag management, and data layers as she.
As a consultant at boutique agency 33 Sticks, she helps clients streamline the implementation process and get more value out of their tools, decreasing costs and headaches for developers, project managers, and analysts alike. On the side, she’s used her background as a developer to create free industry tools like the Adobe Analytics Beacon Parser and the mobile app PocketSDR.
She loves helping and collaborating with others in the industry, and most days can be found in #measure slack or twitter doing just that.
Let’s go to the Atlanta-area to talk with Jenn Kunz
Those of us in the digital economy think a lot about growing our business, but we don’t think as much about the tech that enables customers to interact with our business. When our sites don’t run smoothly or aren’t available, our customers suffer and it stops working as our sales and marketing engine. Terms for these episodes: the site crashed or it croaked, give us a perception that sites are either alive and well or completely dead, when its health really resembles our own human health. Meaning, a website can give off warning signs that can be diagnosed and treated before anything really bad happens. It doesn’t take invasive tools to catch these; monitoring services that run without any special site access can detect issues. These tools that take a site’s pulse are also good to gauge the site’s fitness – its ability to handle business growth.
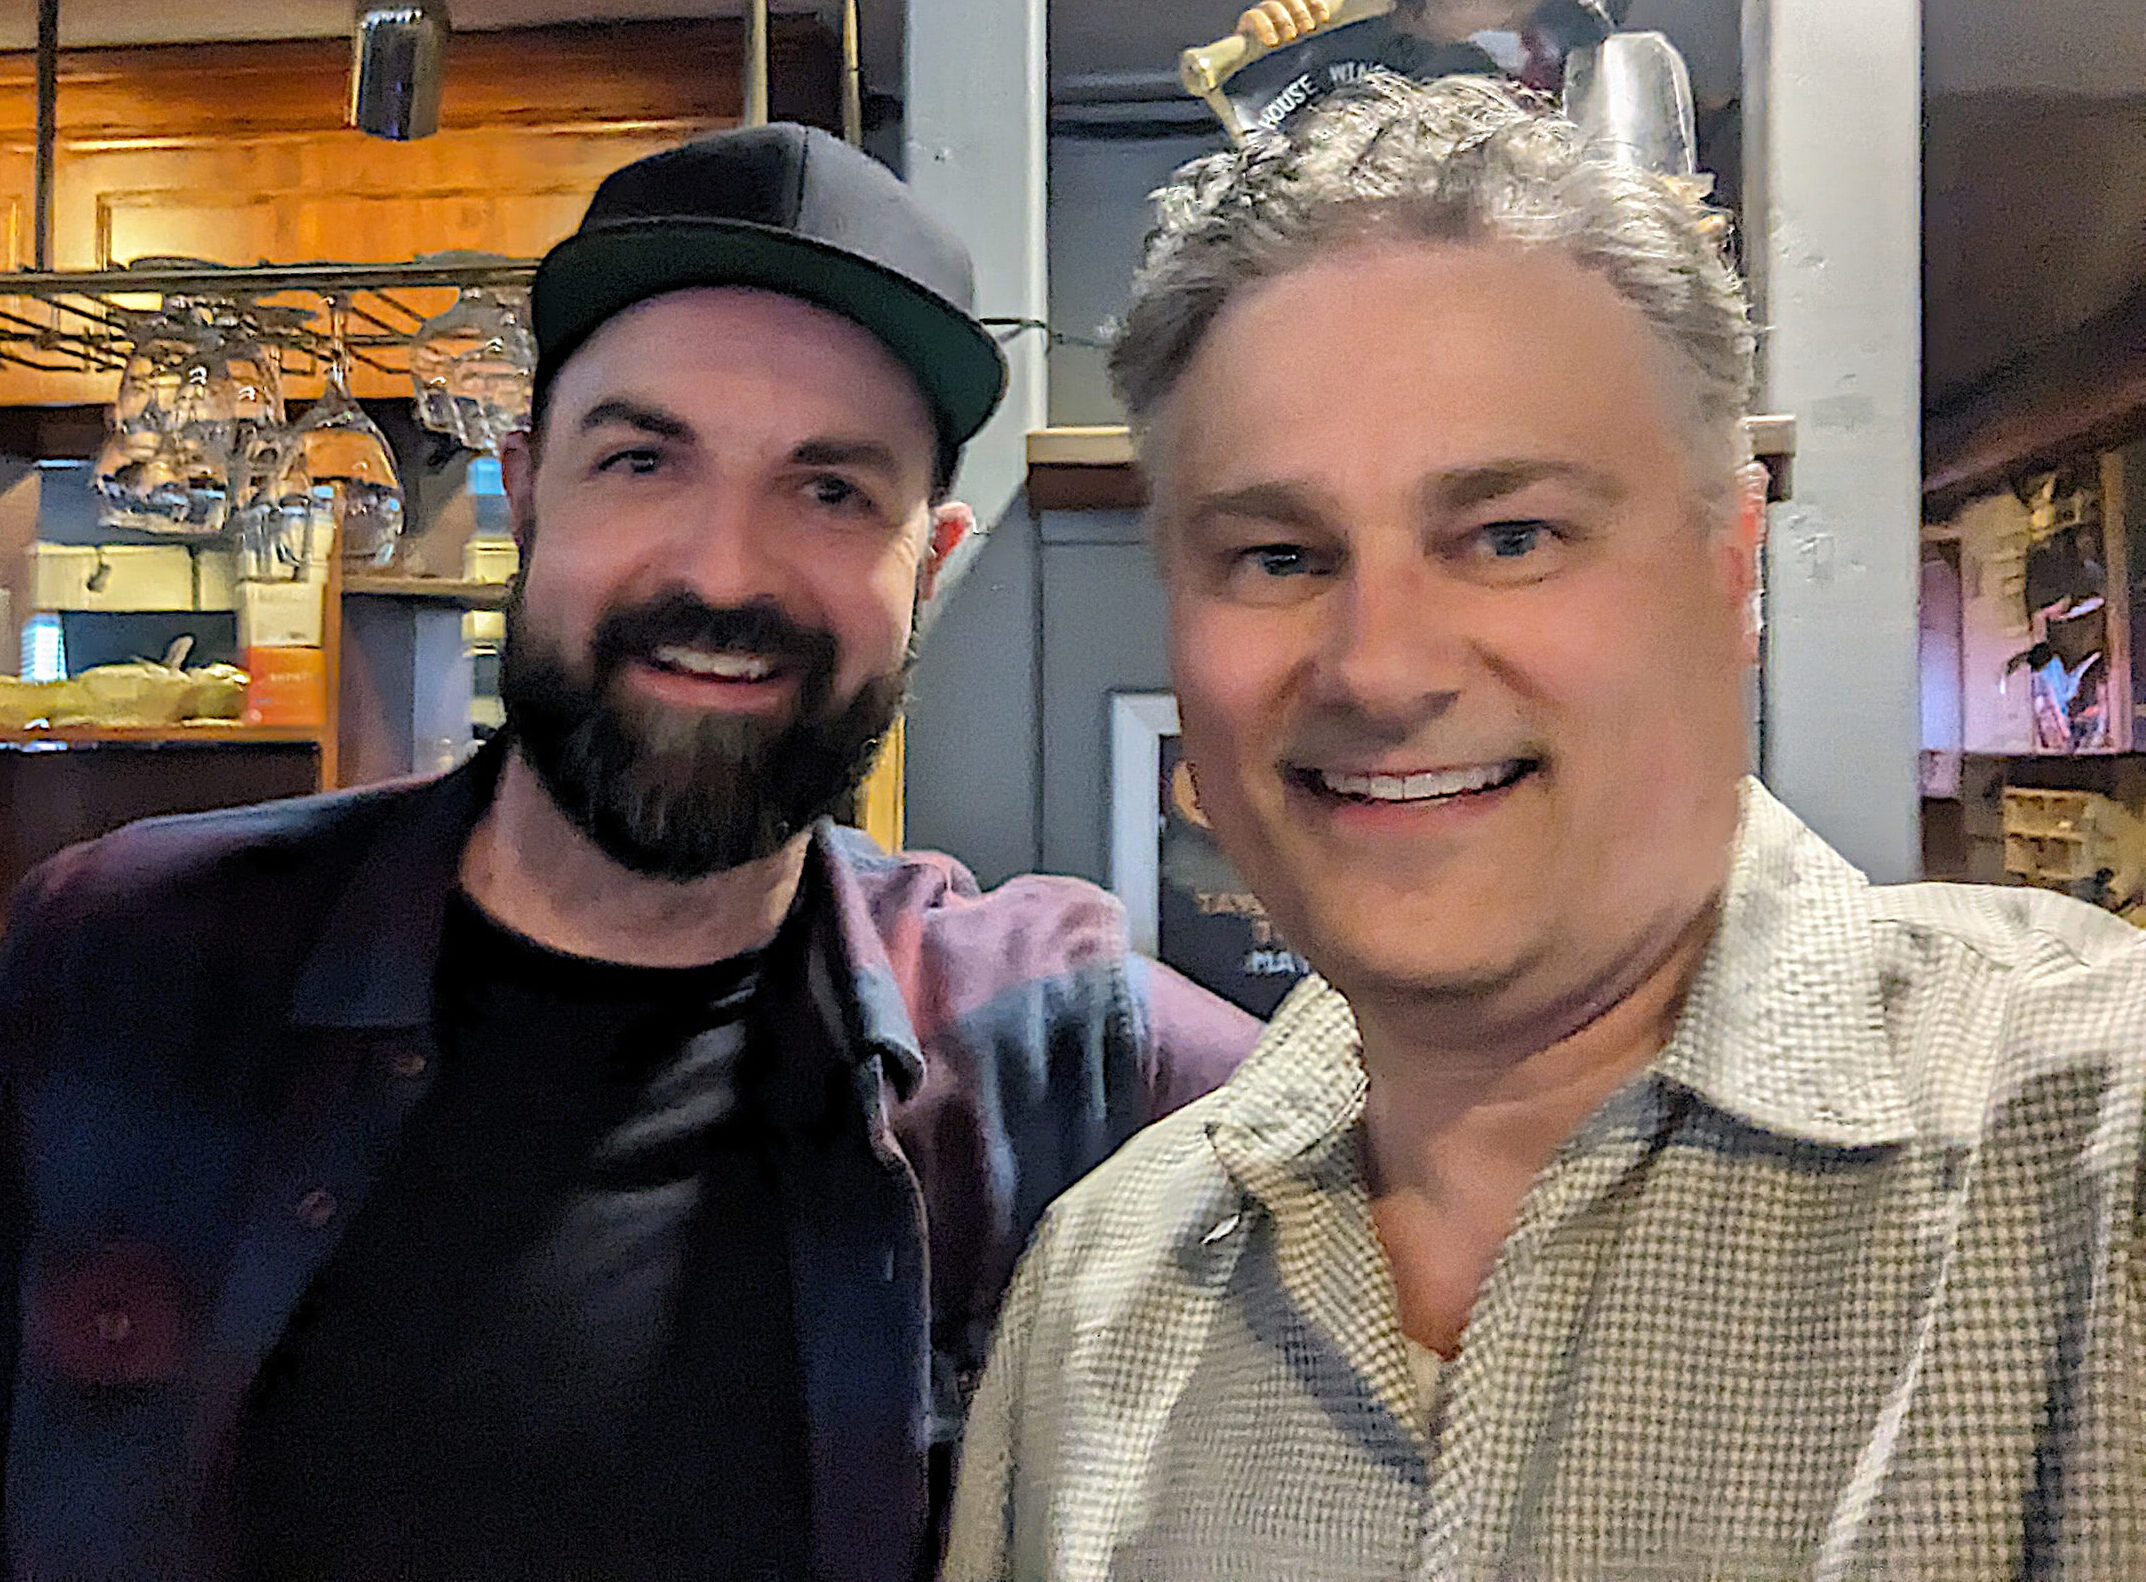
Our guest has always called Ottawa Canada his home. He has also always had an entrepreneurial spirit, supporting the local startup scene since the 2000s, which is where I first met him.
After earning his computer science degree, he began his career working at local web tech firms. A stint at a design agency stoked his enthusiasm for websites, and in 2010 he joined the parent company of Internet Service Provider and web host Rebel.com, and domain registrar Internic.ca.
He took on the role of CEO for both companies, where he saw first-hand how the internet fueled communication and value-creation. In 2013 he took on additional responsibility as a Director of the not-for-profit Canadian Internet Registration Authority (CIRA), where for the last decade more or less he has staunchly pushed for the internet to be used as a force for good in Canada.
Workwise, after stepping away from Rebel and Internic, he returned to his technical and startup roots. Based on his observation that while websites were getting easier for non-experts to build, they could make mistakes hurting their user’s experience of their site with equal ease. That led him to launch ONIK, a product that monitors website fitness.
Let’s go talk with Rob Villeneuve
Chapter Timestamps
00:00:00 – Intro
00:03:06 – Welcome Rob
00:09:19 – Monitoring site health
00:29:09 – PSA
00:29:59 – How much access is needed to monitor a site
00:41:01 – Holding different patrs of site to different standards
We’ve all heard of 1970’s Apollo 13 mission that was supposed to send a 3-man crew to the moon, but once NASA became aware of an on-board explosion, it became all about rescuing the crew.
Ron Howard’s 1995 movie gives a glimpse of how mission control staff in Houston reacted to information about the explosion.
When an alarm on the command module flashed, signaling a power drop, Flight Director Gene Kranz (portrayed by Ed Harris) turned to the mission controller in charge of emergencies and said “is this an instrumentation problem, or are we looking at real power loss here?” That officer, named Sy Liebergot and played by the director’s brother Clive Howard said “It’s, it’s reading a quadruple failure – that can’t happen! It’s, it’s got to be instrumentation.”
But by following their procedures, NASA confirmed it wasn’t an instrumentation problem, the ship had actually suffered a devastating explosion, and at that point they swung into rescue mode.
NASA aren’t the only ones who, on seeing data put in front of them, are so quick to dismiss it.
Dashboards – and the work it takes to implement them – isn’t trivial. Yet many of them fail…meaning that once they’re built they never get looked at.
There are those who blame technical problems for this, but just like in Apollo 13, the main failures are due to people problems. The technology can be used to visualize exactly the operational data that people literally asked for…and present them with self-serve solutions, but they ignore the data, waving it away as some sort of instrumentation problem
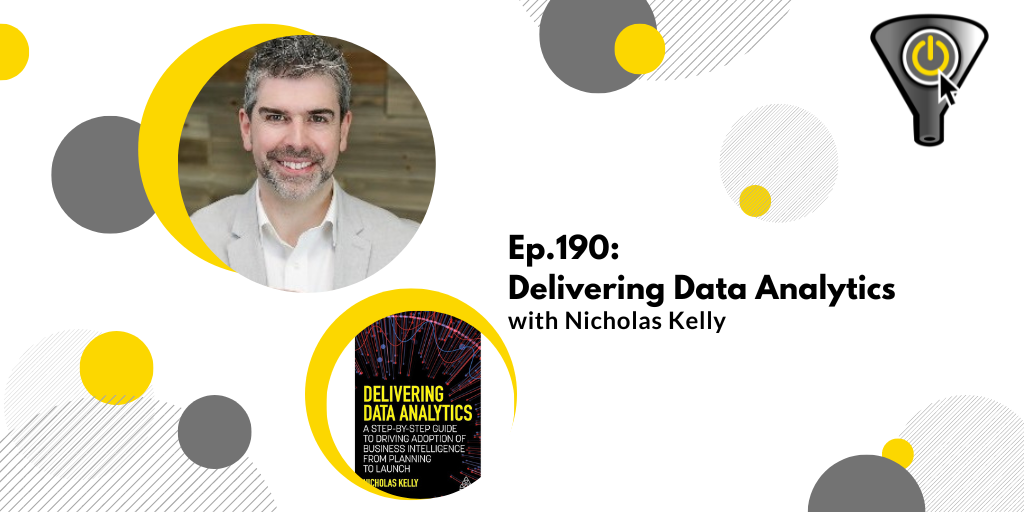
Our guest is going to tell us the right way to pull off dashboard projects.
He’ll show how to engage the stakeholders to express what metrics they really need, ones that show how the organization is tracking towards reaching its vision.
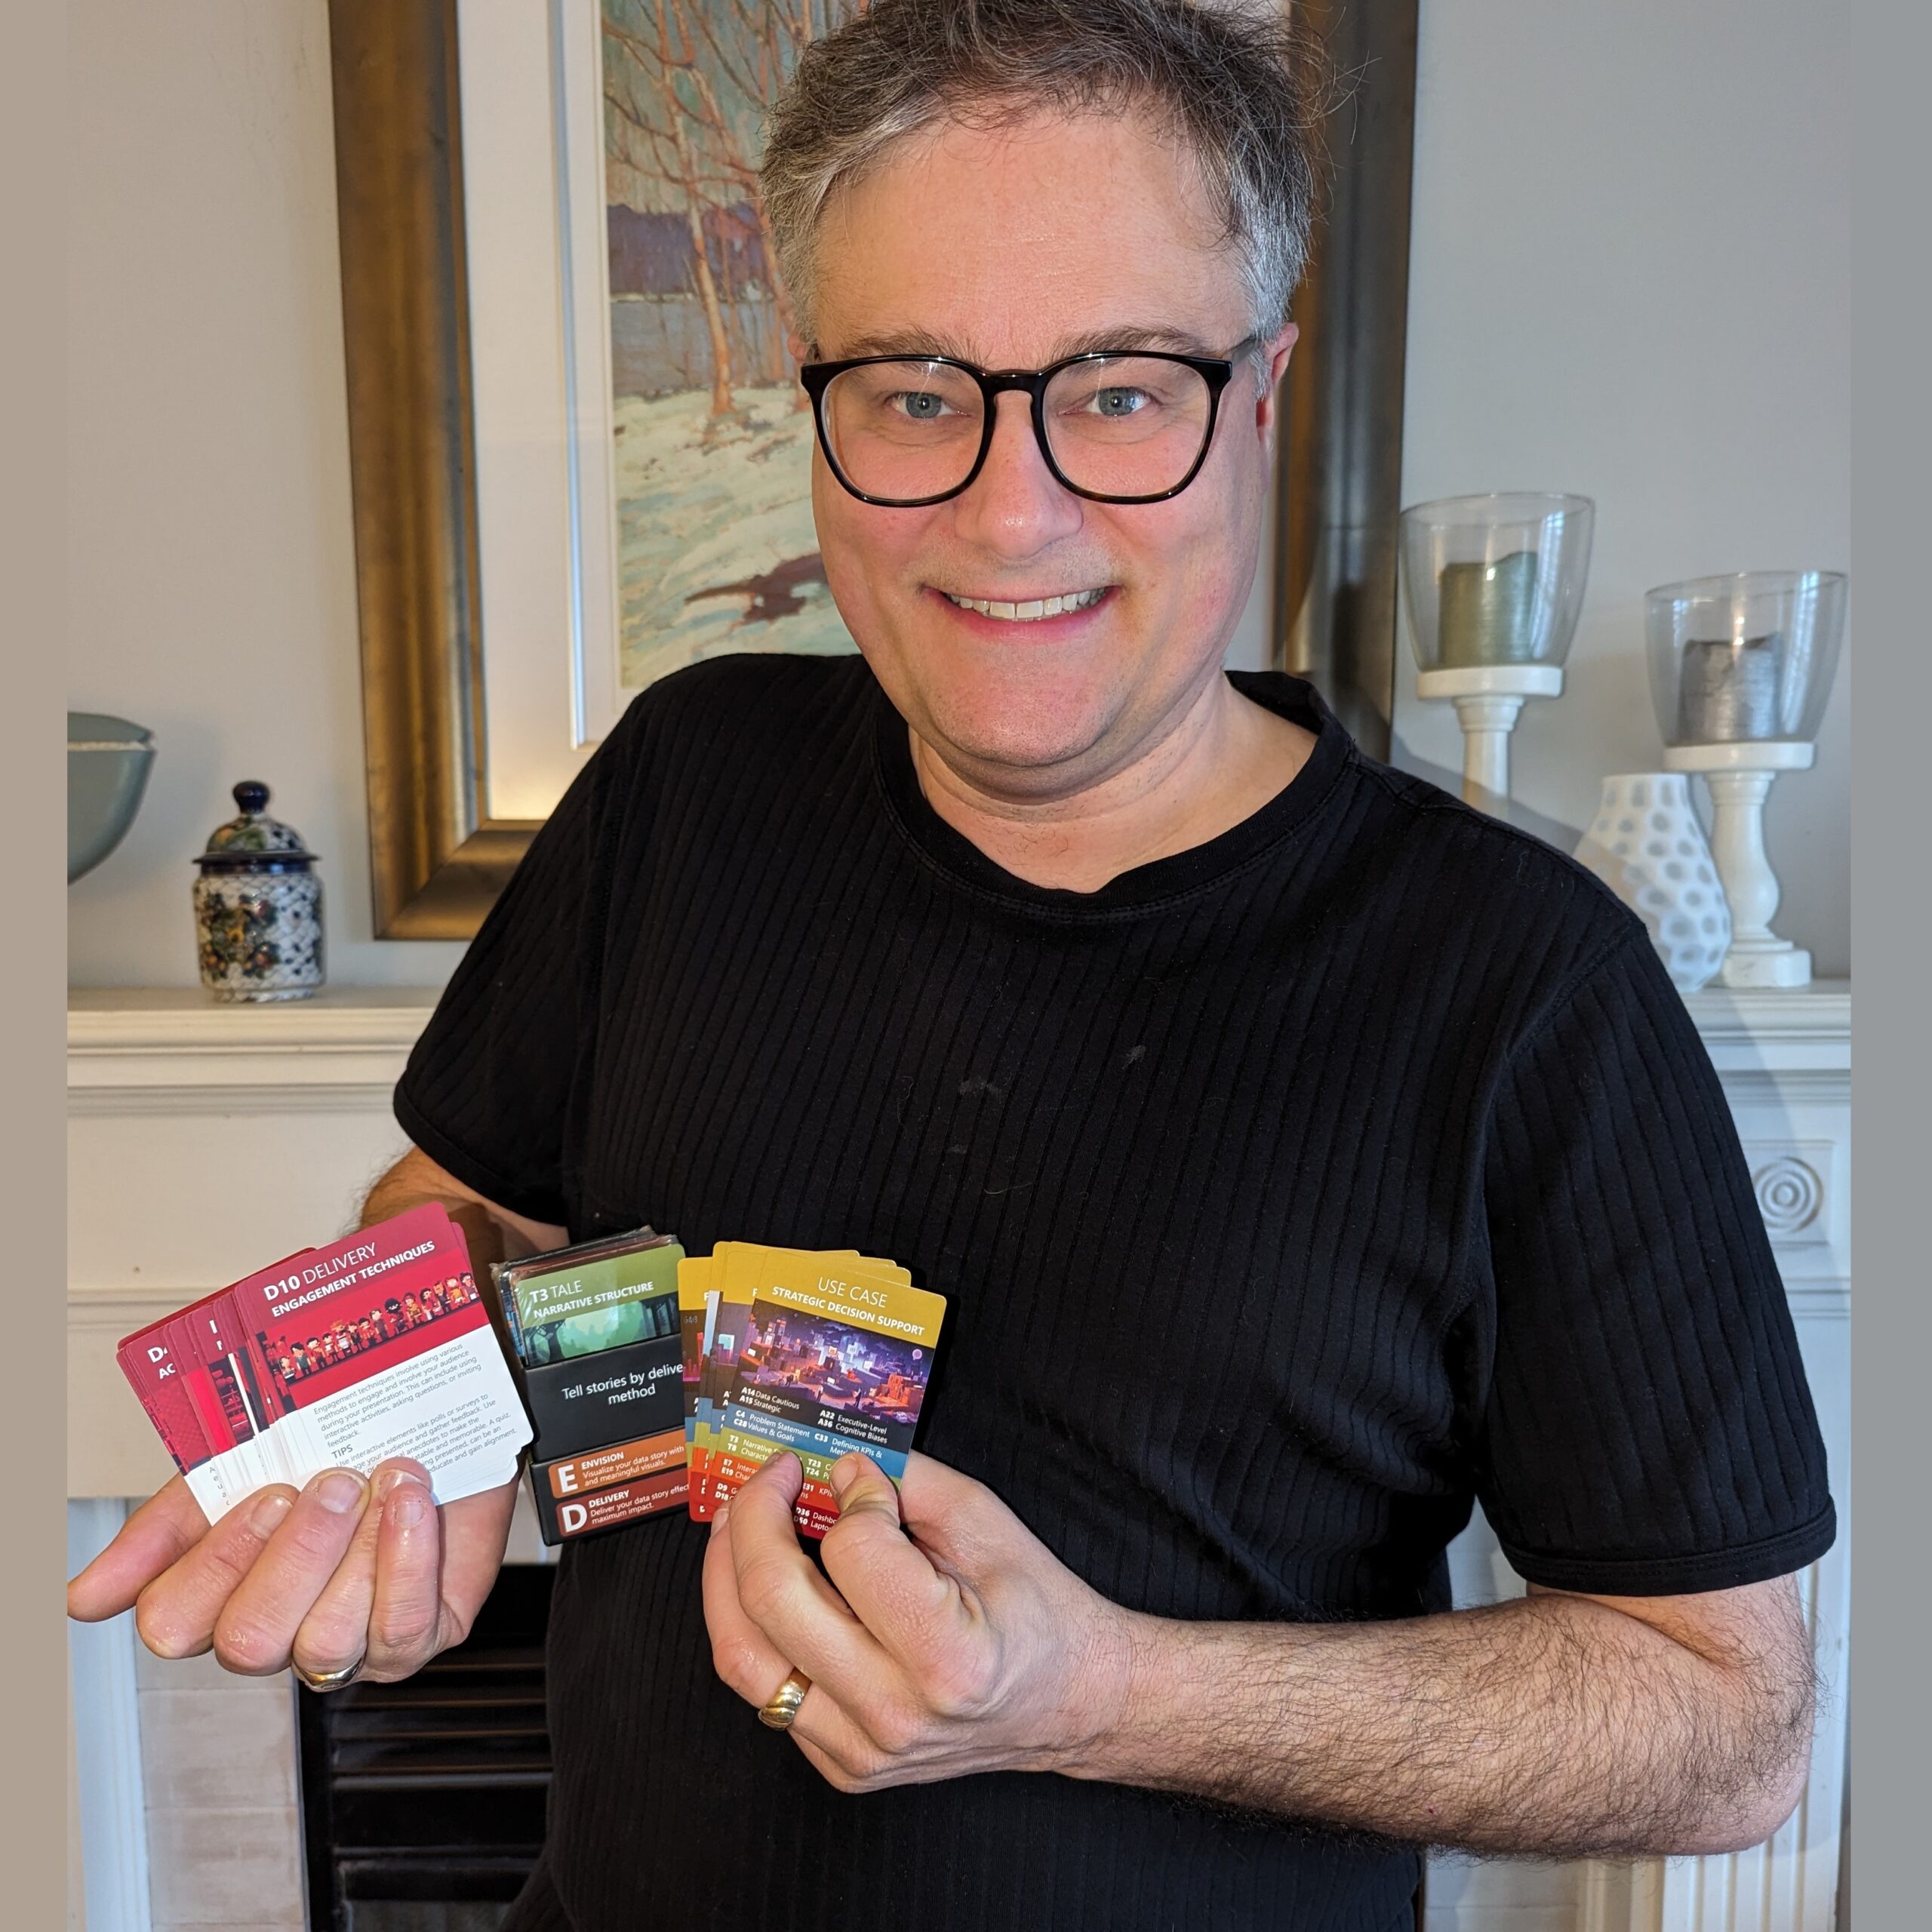
Nicholas Kelly, currently the principal consultant and trainer at G&K Consulting, holds a Bachelor of Computer Science from University College Cork. Formerly a Deloitte Analytics Senior Manager, he specializes in designing and developing dashboards for major global companies, including banks and Formula 1 teams. Nick is a frequent speaker at international conferences, having trained thousands of professionals in data visualization and analytics adoption. As a management consultant, educator, and author, his focus is on teamwork, inventive methods, and bridging technical gaps to increase data literacy. He is also the creator of business board games and the author of the book “Delivering Data Analytics.”
Let’s go to Seattle where I caught up with Nick Kelly.
My sister-in-law Janice works at the forefront of Medical Sonography. You may know it by the name Ultrasound, where non-invasive sound waves are sent into the body, which bounce off tissue and get displayed on a monitor. It has the ability to evaluate anatomy in an increasingly wide range of structures such as abdominal organs, the heart, vasculature and muscles in patients of all ages as well as the most commonly known purpose of obstetrical ultrasound.
In the past 35 years, ultrasound has changed from a tool that was used solely by Radiology and has now expanded into being used by almost every medical disciple: cardiology, emergency medicine, anesthesia, nursing, physical therapy and more. Training these non-traditional users had a huge boom, and now ultrasound is being taught in the first year of medical school as it is known that no matter what type of medicine one chooses, ultrasound will play a part. Janice and others have shared their love and knowledge of ultrasound to help and aid the expansion of ultrasound into new realms in all areas of healthcare.
In a similar way, to be better marketers, developers, or website owners, there are aspects of web behaviour that we need surfaced: specific user conversions, page views, scrolls and many other interactions. These aren’t visible to Analytics tools out-of-the-box. Our equipment must be configured to highlight them, and that’s done with tags that fire and alert our analytics software of specific interactions, the same way that medical monitors show the echoes of specific sonar frequencies.
We’ve evolved from coding tags right on our sites to operating them with tag management systems, the most common one being Google Tag Manager. Without these tagging tools, our visibility into site performance would be limited the same way that doctors before ultrasound couldn’t see what was going on inside their patients.
Another similarity these tools share is that they both come with ethical and safety considerations, and laws covering user privacy and data protection. Gathering insights, whether by ultrasound or tag technology, must respect the digital autonomy and privacy of users.
We have a guest to take us through all facets of tag management and I hope that after hearing him, you won’t think of tagging as just some machine that should be relegated to technicians, but a tool you can use on the front-lines, as something you yourself should get hands-on with. So let’s talk about tag management with Ricardo Cristofolini.
With a background in Tourism and Hospitality Management and International Trade, Ricardo Cristofolini’s Analytics professional journey began when he arrived in Canada in 2015 to study at Algonquin College of Applied Arts and Technology, where he earned an Ontario College Diploma in Computer Programming, Networked Environment, and Programming Languages from 2015 to 2017. There, he had the opportunity to put together previous professional knowledge with brand new one exploring multiple subjects, from Web and App Development to cloud computing, Database structure, and much more.
Transitioning to the workforce, Ricardo served as a Web Developer at FilmFX from December 2017 to December 2019, gaining two years of experience. In March 2018, Ricardo expanded his skills at Pondstone Digital Marketing, specializing in WordPress, Content Management, and other relevant areas until February 2019. At this point, he had already fallen in love with Analytics and Data Tracking. His expertise continued to evolve as he took on the role of Senior Data Analytics Implementation at Bounteous Canada from July 2021 to October 2022 He currently holds the position of Napkyn Senior Implementation Specialist Data Solutions, a role he has been dedicated to since 2022.
In his spare time, when not reading about Analytics and developing his knowledge (and earning a badge from Linkedin as Top Web Analytics Voice), Ricardo supports others’ new adventures in this field on multiple social media platforms answering questions and providing guidance.
Originating from Brazil, Ricardo Cristofolini’s professional trajectory reflects a dynamic and progressively challenging path within the realms of web development, digital marketing, and data analytics implementation.
Dana DiTomaso embarked on her digital marketing journey over 20 years ago, initially working in tech support for a CRM before founding a web design company in 2002. In 2000, clients sought her expertise in increasing website traffic, propelling her into the world of Search Engine Optimization (SEO). By 2012, Dana became an active participant in the SEO community, sharing insights on technical and local SEO topics.
Dana, having typed her first line of code in 1982, consistently demonstrated an entrepreneurial spirit and started delivering talks and presentations since 1998. Recognizing the potential of digital-first marketing, she founded three businesses that educate entrepreneurs and organizations. As the founder and lead instructor of KP Playbook, Dana teaches the “Analytics for Agencies” course and manages a thriving learner community, emphasizing proven principles over quick tips. Notably, none of her clients have faced Google penalties to date.
Dana lives in an old growth forest near Victoria BC.
Chapter Timestamps
00:00:00 – Intro
00:03:01 – Welcome Dana
00:08:18 – The unvarnished view of data given by GA4
00:16:33 – Using custom reports and exploration tab
00:22:41 – Giving other users access to Reports
00:26:39 – PSA
00:27:25 – Reporting through Looker Studio
00:35:08 – Why knowing some UX helps
00:38:54 – Pulling other data sources together with GA data