Episode 169
You did everything just the way you were told.
You took the tags the free tools gave you and installed them on your site, you configured platforms and poured over their reports, you connected the systems and even hired developers to hook everything up to a database. And yet, you have little value to show for all the work you’ve put into your company’s analytics
You feel the analytics platforms are backing away from their responsibility to streamline all this. Instead, the answer from the largest of the bunch, Google, is they’ll hold onto your data if you use their newest tool, BigQuery, and pay them money to store your data …or is it their data… on it.
The bad news is summed up in a 2023 book whose euphemistic name is “You’re data is flawed”– don’t want to get an explicit rating for using the actual name
It was written by someone who empathizes with our situation and who lays out in the book the steps needed to generate positive financial returns for our analytics investment.
Our guest Mark McKenzie started his career in London, but moved in 2014 to sunny New Zealand to work for a data-focused digital agency. That led to him founding and growing an analytics firm that served clients locally and in the UK, Australia, and the US. Following the sale of that firm in 2022, he moved with his family back to the not-so-sunny UK. where he’s consulting with on digital analytics
His focus on analytics can be seen through his volunteering at events such as ‘MeasureCamp’ and ‘Web Analytics Wednesdays.’ Let’s talk with Mark McKenzie.
People/Products/Concepts Mentioned in Show
Mark’s MckTui consultancy
The Circles of Hell in Dante’s Inferno
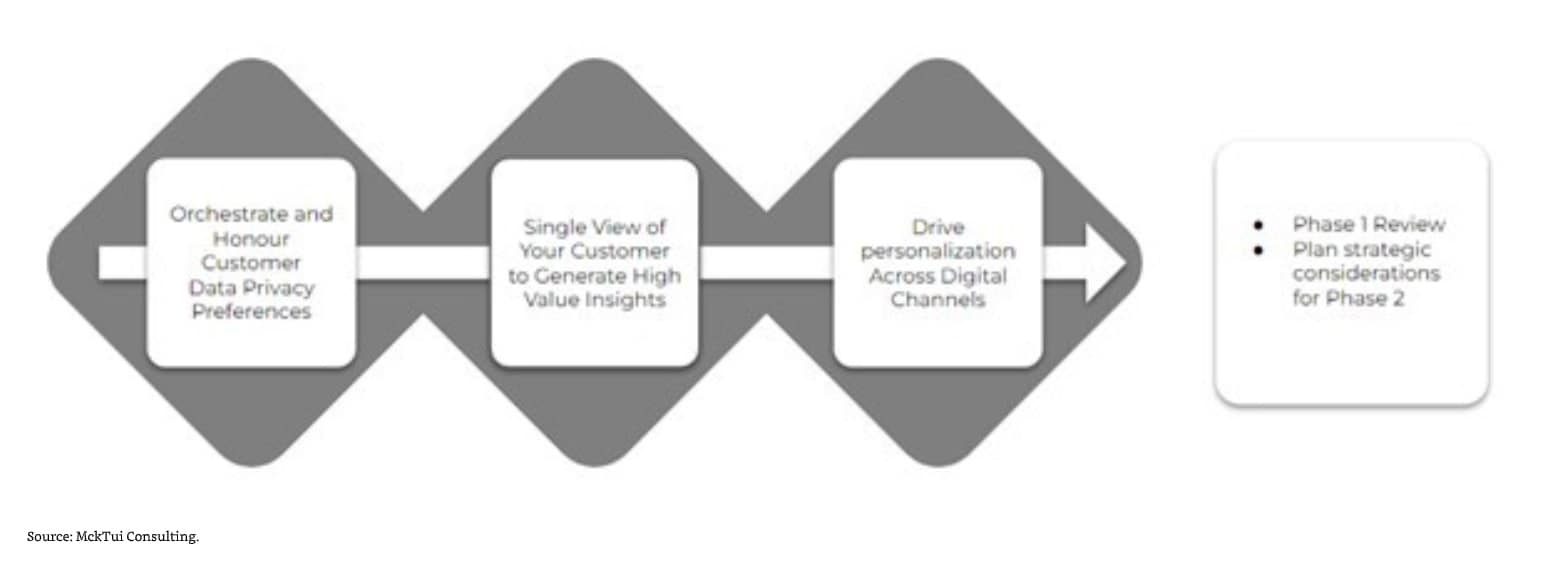
With Federated IDs, a company personalizes an experience for someone using digital data that was sourced (but not shared with the company) from multiple external systems.
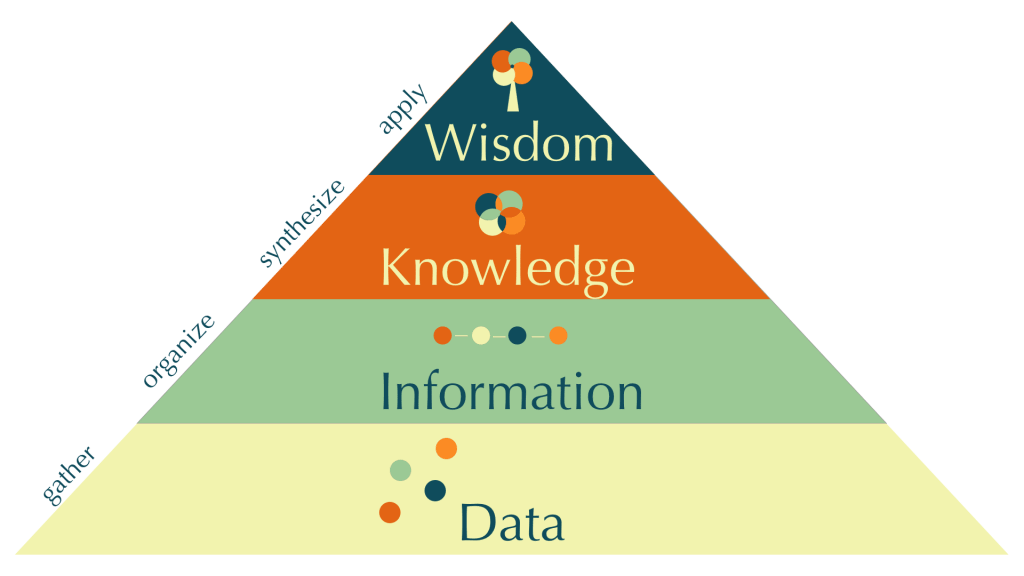
The DIKW Pyramid of Data, Information, Knowledge, and Wisdom
Landmark blog post on Digital Analytics Immaturity
Chapters & Timestamps
0:00:00 Intro
2:26 Admitting our data is f_____ed
10:22 Prior to fixing data, must treat it as an asset
39:29 Fixing data we keep internally
54:47 The book and Mark’s contact info