Today’s topic is AI and ML, and though you may think this doesn’t concern marketing, we need to acknowledge how it’ll shift things.
Up to now, marketing was done on the premise that for a given audience shown a message, some average percentage, would act on it. With AI, we’re now able to look at individual audience members and predict how each of them would act upon a message, and at the opportune moment we could have the message show up to each one of them. Goodbye analyzing what happened with crude audience averages, Hello to using detailed data to predict what’s likely to happen.
With AI holding such promise, why don’t more companies hand things over to AI? I had thought it’s held up by a lack of technical people who know how to do this, but our guest says we’ve had enough technical expertise – He himself was previously one of those data people, and his expertise wasn’t enough to do the job. He says AI initiatives are held back by those running business functions like marketing who haven’t made the business case and collaborated with the data people to implement this.
My guest is a leading consultant and former Columbia University and UVA Darden professor. He is the founder of the long-running Machine Learning Week conference series, a frequent keynote speaker, and author of the bestselling Predictive Analytics: The Power to Predict Who Will Click, Buy, Lie, or Die. In 2023 he authored “The AI playbook”
Let’s talk to Eric Siegel.
Timestamps/Chapters:
0:00:00 Intro 00:01:37 Welcome Eric Siegel 00:01:56 Barrier we face isn’t technical know-how 00:06:05 Despite a strong start – AI’s been slow to spread 00:11:17 Process a business needs to implement ML 00:27:41 building a custom algorithm 00:29:45 PSA 00:52:32 The human-side of the switchover 00:54:03 Contacting Eric
People, products or concepts mentioned in the show:
Today, we are going to talk about how those of us who sell things find new buyers once we’ve exhausted our own audiences. We involve partners, and we can do this in a few ways. These partners may have high-traffic sites or be social media influencers. We are trying to use someone else’s channel to reach their audience, hoping they will buy from us.
Alternatively, we might be the ones who are influential or have a large audience that brands want to reach, so they pay us to be their marketing channel. The name for teaming up like this is affiliate marketing.
Today’s guest came to affiliate marketing through dabbling in online gambling. He watched the incentives sites put out to attract players, and then in 2010, he created a website that reviewed gambling affiliate programs called Gaming Affiliates Guide. This site’s traffic led him to become, you guessed it, an affiliate. Over time, he managed several gambling affiliate sites.
As you progress in this field, you always hit a ceiling with this marketing channel. No matter whether you’re the one needing traffic and paying for it, or the one who has traffic and is turning it into money, everyone gets a headache tracking it. As our guest was deeply involved at this point, getting paid to manage affiliate sites, he saw numerous problems in this industry and saw a way to solve them.
There were already applications that reported affiliate activity, but he saw these technologies’ shortcomings. With his engineering degree from the University of Toronto, which had taught him how to develop things, he joined up with partners to create a SaaS tool of their own: StatsDrone.
Having scratched an itch he experienced earlier in his career, he now heads a team whose tool addresses affiliate challenges.
We all want our organization’s decisions to be driven by the numbers. Who wouldn’t want to have at their fingertips analytics that accurately show which course of action will be best.
But doing this takes analysts, and that doesn’t mean hiring them, it means managing them to function well. It means creating processes for them, Outfitting them with technology. Giving them budgets.It’s hard pulling this off in a small or mid-sized organization, and even leaders of large organizations must exercise care when creating this.
But there’s no set-in-stone law that says a data team must be in-house. Another model, managed services works well for IT and it can be used to give companies access to analysts so they can still be data-driven.
We’re going to explore the outsourced analytics model with today’s guest.
Throughout his career, he has worked at the intersection of data, business, and strategy consulting. He earned his Bachelor’s Degree from the University of Wisconsin-Eau Claire.
Following graduation, he joined Cargill as a Data Engineer from June 2011 to November 2013. He went on to serve as the Analytics Lead at Slalom from December 2013 to February 2016, where he claims to have been Minneapolis’ first Analytics Hire.
In 2017, he co-founded DataDrive, a managed service provider specializing in analytics, alongside fellow data enthusiasts.
There’s more than one way to skin a cat. Being honest, doing something differently is often neither better or worse, it’s just different.
– Playing Music with an acoustic vs electric guitar
– Writing with a pen on paper vs a computer. And continuing on that theme, it could be a Mac or a PC
– Programming can be done in various languages
– Films can be made with a variety of filming equipment, anything from an iPhone up to an IMAX ALEXA 65mm
This also applies to what we use as our analytics tool. And though Google Analytics gets a lot of attention, including in this podcast, to be fair, it is not the only game in town. The industry has a second tool, Adobe Analytics and I wanted to talk with an expert, and to my mind, today’s guest is the person to talk to about it.
She has 15+ years of experience helping enterprise organizations solve their analytics problems holistically, no matter where they are in their digital measurement evolution or what tool set they use.
Few can go as deep on pixel implementation, tag management, and data layers as she.
As a consultant at boutique agency 33 Sticks, she helps clients streamline the implementation process and get more value out of their tools, decreasing costs and headaches for developers, project managers, and analysts alike. On the side, she’s used her background as a developer to create free industry tools like the Adobe Analytics Beacon Parser and the mobile app PocketSDR.
She loves helping and collaborating with others in the industry, and most days can be found in #measure slack or twitter doing just that.
Let’s go to the Atlanta-area to talk with Jenn Kunz
Those of us in the digital economy think a lot about growing our business, but we don’t think as much about the tech that enables customers to interact with our business. When our sites don’t run smoothly or aren’t available, our customers suffer and it stops working as our sales and marketing engine. Terms for these episodes: the site crashed or it croaked, give us a perception that sites are either alive and well or completely dead, when its health really resembles our own human health. Meaning, a website can give off warning signs that can be diagnosed and treated before anything really bad happens. It doesn’t take invasive tools to catch these; monitoring services that run without any special site access can detect issues. These tools that take a site’s pulse are also good to gauge the site’s fitness – its ability to handle business growth.
Our guest has always called Ottawa Canada his home. He has also always had an entrepreneurial spirit, supporting the local startup scene since the 2000s, which is where I first met him.
After earning his computer science degree, he began his career working at local web tech firms. A stint at a design agency stoked his enthusiasm for websites, and in 2010 he joined the parent company of Internet Service Provider and web host Rebel.com, and domain registrar Internic.ca.
He took on the role of CEO for both companies, where he saw first-hand how the internet fueled communication and value-creation. In 2013 he took on additional responsibility as a Director of the not-for-profit Canadian Internet Registration Authority (CIRA), where for the last decade more or less he has staunchly pushed for the internet to be used as a force for good in Canada.
Workwise, after stepping away from Rebel and Internic, he returned to his technical and startup roots. Based on his observation that while websites were getting easier for non-experts to build, they could make mistakes hurting their user’s experience of their site with equal ease. That led him to launch ONIK, a product that monitors website fitness.
Let’s go talk with Rob Villeneuve
Chapter Timestamps
00:00:00 – Intro
00:03:06 – Welcome Rob
00:09:19 – Monitoring site health
00:29:09 – PSA
00:29:59 – How much access is needed to monitor a site
00:41:01 – Holding different patrs of site to different standards
My sister-in-law Janice works at the forefront of Medical Sonography. You may know it by the name Ultrasound, where non-invasive sound waves are sent into the body, which bounce off tissue and get displayed on a monitor. It has the ability to evaluate anatomy in an increasingly wide range of structures such as abdominal organs, the heart, vasculature and muscles in patients of all ages as well as the most commonly known purpose of obstetrical ultrasound.
In the past 35 years, ultrasound has changed from a tool that was used solely by Radiology and has now expanded into being used by almost every medical disciple: cardiology, emergency medicine, anesthesia, nursing, physical therapy and more. Training these non-traditional users had a huge boom, and now ultrasound is being taught in the first year of medical school as it is known that no matter what type of medicine one chooses, ultrasound will play a part. Janice and others have shared their love and knowledge of ultrasound to help and aid the expansion of ultrasound into new realms in all areas of healthcare.
In a similar way, to be better marketers, developers, or website owners, there are aspects of web behaviour that we need surfaced: specific user conversions, page views, scrolls and many other interactions. These aren’t visible to Analytics tools out-of-the-box. Our equipment must be configured to highlight them, and that’s done with tags that fire and alert our analytics software of specific interactions, the same way that medical monitors show the echoes of specific sonar frequencies.
We’ve evolved from coding tags right on our sites to operating them with tag management systems, the most common one being Google Tag Manager. Without these tagging tools, our visibility into site performance would be limited the same way that doctors before ultrasound couldn’t see what was going on inside their patients.
Another similarity these tools share is that they both come with ethical and safety considerations, and laws covering user privacy and data protection. Gathering insights, whether by ultrasound or tag technology, must respect the digital autonomy and privacy of users.
We have a guest to take us through all facets of tag management and I hope that after hearing him, you won’t think of tagging as just some machine that should be relegated to technicians, but a tool you can use on the front-lines, as something you yourself should get hands-on with. So let’s talk about tag management with Ricardo Cristofolini.
With a background in Tourism and Hospitality Management and International Trade, Ricardo Cristofolini’s Analytics professional journey began when he arrived in Canada in 2015 to study at Algonquin College of Applied Arts and Technology, where he earned an Ontario College Diploma in Computer Programming, Networked Environment, and Programming Languages from 2015 to 2017. There, he had the opportunity to put together previous professional knowledge with brand new one exploring multiple subjects, from Web and App Development to cloud computing, Database structure, and much more.
Transitioning to the workforce, Ricardo served as a Web Developer at FilmFX from December 2017 to December 2019, gaining two years of experience. In March 2018, Ricardo expanded his skills at Pondstone Digital Marketing, specializing in WordPress, Content Management, and other relevant areas until February 2019. At this point, he had already fallen in love with Analytics and Data Tracking. His expertise continued to evolve as he took on the role of Senior Data Analytics Implementation at Bounteous Canada from July 2021 to October 2022 He currently holds the position of Napkyn Senior Implementation Specialist Data Solutions, a role he has been dedicated to since 2022.
In his spare time, when not reading about Analytics and developing his knowledge (and earning a badge from Linkedin as Top Web Analytics Voice), Ricardo supports others’ new adventures in this field on multiple social media platforms answering questions and providing guidance.
Originating from Brazil, Ricardo Cristofolini’s professional trajectory reflects a dynamic and progressively challenging path within the realms of web development, digital marketing, and data analytics implementation.
Dana DiTomaso embarked on her digital marketing journey over 20 years ago, initially working in tech support for a CRM before founding a web design company in 2002. In 2000, clients sought her expertise in increasing website traffic, propelling her into the world of Search Engine Optimization (SEO). By 2012, Dana became an active participant in the SEO community, sharing insights on technical and local SEO topics.
Dana, having typed her first line of code in 1982, consistently demonstrated an entrepreneurial spirit and started delivering talks and presentations since 1998. Recognizing the potential of digital-first marketing, she founded three businesses that educate entrepreneurs and organizations. As the founder and lead instructor of KP Playbook, Dana teaches the “Analytics for Agencies” course and manages a thriving learner community, emphasizing proven principles over quick tips. Notably, none of her clients have faced Google penalties to date.
Dana lives in an old growth forest near Victoria BC.
Chapter Timestamps
00:00:00 – Intro
00:03:01 – Welcome Dana
00:08:18 – The unvarnished view of data given by GA4
00:16:33 – Using custom reports and exploration tab
00:22:41 – Giving other users access to Reports
00:26:39 – PSA
00:27:25 – Reporting through Looker Studio
00:35:08 – Why knowing some UX helps
00:38:54 – Pulling other data sources together with GA data
As a Disclaimer, note that there’s no sponsor or affiliate relationship with the vendor interviewed here. They’re simply on the show to give their perspective on our topic.
As trite as it sounds, the way that we look at the world affects our understanding of it. Let me tell you about a time I noticed this. When I was a kid, I would go to school, walk into my classroom, and see my teacher there. She was such a constant there, I imagined that she never left the classroom, she was a fixture of the room, part of the furniture. It’s like the teacher didn’t persist as a person who had a life outside of the classroom. So when I was out at the grocery store with my parents and I saw my teacher, not dressed in their teacher clothes, not ensconced in their teacher setting, my brain just melted.
While this might be laughable, those of us using marketing analytics tools could be guilty of falling into the same trap. Credit for making this concept clear in not 1 but 2 great books must go to Avinash Kaushik. Think about it. According to Classic web analytics, visitors who hit our website had started an imaginary timer that we called a web session. We imagined in this race against the clock, they were viewing a sequence of pages which ferried them to forms we used as gates. We told ourselves that the gate-crossers had completed a successful session, converting from visitors into leads or customers.
Stepping back, there are a few things wrong with this picture. Users don’t only exist inside of a session, just like the teacher didn’t only exist in the classroom—they roam about as they please.
Today’s users aren’t confined to marketing content. The experience they have straddles our marketing sites, to sites and apps where their identity persists through being logged-in, where the interactions even span multiple devices – as we see on Slack and Discord for messages we’ve already read.
The user’s state changes – sometimes they complete a purchase, or become a paid subscriber, but at other times they may opt for a free plan or abandon their cart.
We need analytics for all of these actions. We need to step back and view the entire experience that people have with us over time. This is something that classic web analytics just can’t measure.
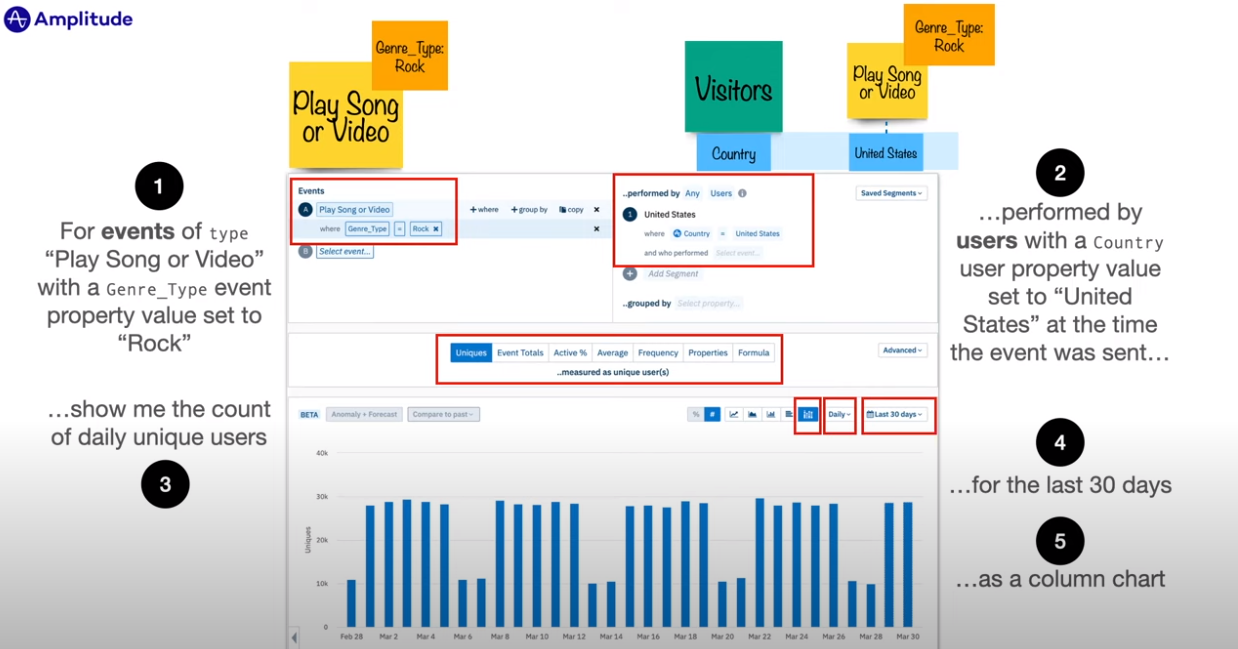
This is why the new generation of tools allows us to analyze complex trends and behavior of our users. They are collectively known as event-based analytics tools, and they excel in portraying the way that users experience a product. The foremost product-oriented analytics tool out there is called Amplitude, and today, we are speaking with its product evangelist.
Since 2021, Adam Greco has been Amplitude’s Product Evangelist, guiding clients in understanding their tool through workshops, blogs, and videos.
He got into this field in 2005 when he joined analytics platform Omniture where he was a customer advocate for four years until Adobe acquired them and rechristened them Adobe Analytics. He then worked at consultancies for 15 years, showing people how to get the most out of Adobe’s tool, authoring over 200 blog posts along the way.
Lately Adam’s speaking and advising on analytics has had him splitting his time between Chicago and Amsterdam (where he was when this was recorded). When he’s in the states and not working, he enjoys restoring and going for drives in his 62 convertible corvette.
Timestamps/Chapters
0:00 – Intro
5:00 – Meet Adam; why event-based method works better than session-based method
24:00 – PSA
24:45 – how to get value out of recent analytics tools, including warehouse-native apps
When a person interacts with their device or goes online, who owns their data? Today’s guest says they do, and marketers should be paying them for the privilege. Right now, you might think this person wears hats made out of tinfoil. It may surprise you to learn they are the Global Head of AI at (EY) Ernst & Young, having also been an analytics executive at Gartner and CSL Behring and graduating from DePaul with an MBA.
John Thompson has written four books. I found out about him through his 2020 book Building Analytics Teams, which led to him being a guest on this show back in 2023. He recently released his book “Data for All” which spurred this repeat appearance – which has only happened with a handful of people.
For links to all persons and concepts mentioned, go to Ep 181’s notes page on the Funnel Reboot site.
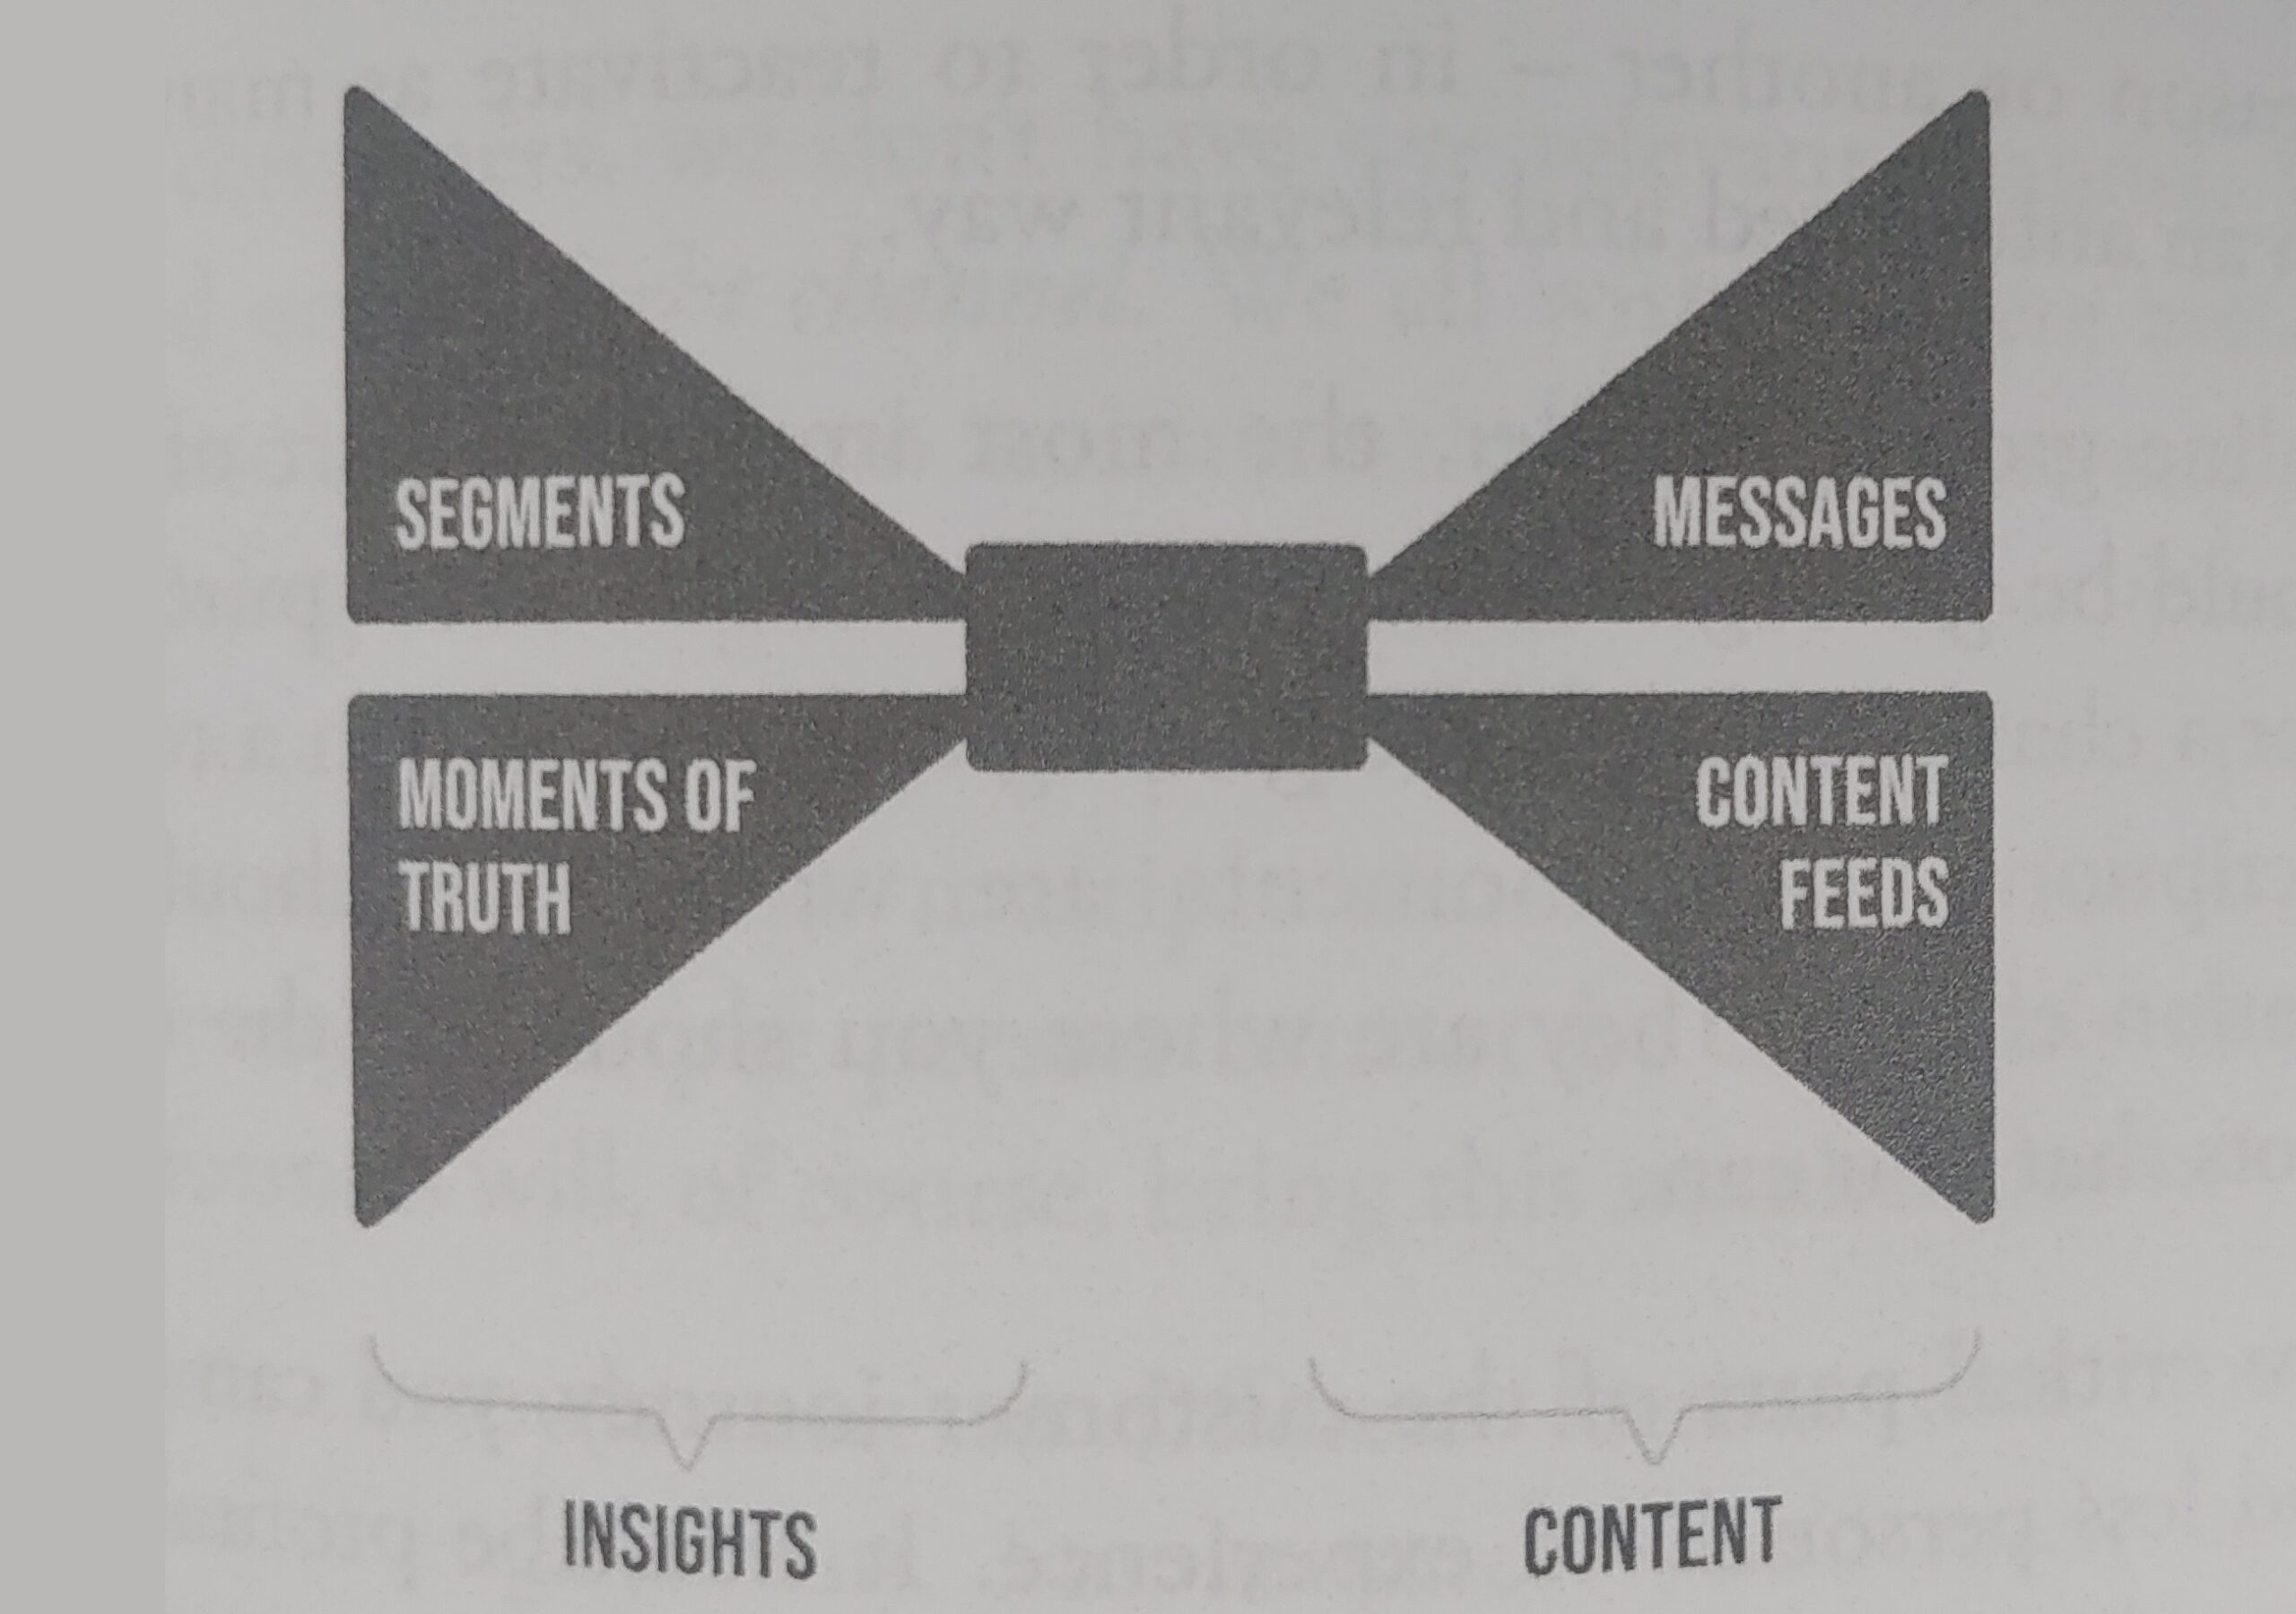
‘1 to 1 Marketing,’ sounds wonderful. Don Peppers & Martha Rogers wrote a series of books in the 1990s called this. We have thrown all kinds of technology, content, and persona construction at it over the last 25 years. But it still eludes us. Architecting communications that converses with each person, at their own point in a conversation with our brand is hard. Is it marketing’s job to actually have 1:1 conversations? And with what’s at stake if we screw up personalization, can we implement or maintain it without losing our jobs?
Today’s guest is here to help answer that.
Since getting his M.A. in Information Studies from Aarhus University, our guest has lived at the intersection of data and communications.
Since 2020 he has been the Chief Experience Officer at Agillic, an omnichannel marketing software, where he works primarily with large companies involved in omnichannel marketing, customer experience management, and customer lifecycle projects.
He’s on a mission to ensure that the end user gets consistent, timely and relevant communications across channels – be it web, email, app, text, social – or even in-store. He often presents keynotes on Omnichannel Personalization and sits on the jury for that at the Danish eCommerce Awards.
His first book, written together with Colin Shearer, was a bestseller on Omnichannel Marketing. We’re talking with him about his book “Hello $Firstname,” which came out in 2023. Joining me from Copenhagen, let’s welcome Rasmus Houlind.